 Aplas Docs
Getting started with Aplas
What Aplas holds, how you fill it, and how you publish it
Aplas catalogues what your organization runs, renders it as views you can read, and publishes those views to the people who need them.
Three ideas carry the whole product:
- Inventory — what you have. Assets, grouped into asset types you define, with fields and relations of your choosing.
- Views — ways of looking at the inventory. The same assets render as a map, a table, a matrix, a graph or a flow.
- Publications — a view made available at a URL, to the members of your organization.
Everything else in the studio serves one of those three.
Aplas is being migrated from an earlier model built specifically around software indexes, maps and styles. If your organization still uses that model, the pages under Legacy (v1 organizations) describe it.
Setting up your workspace
A new organization opens on Set up your workspace. Two answers shape everything after it — your industry and your rough scale — because both are used to read whatever data you bring in later.
Your industry primes every draft: a bank's systems read differently to a logistics firm's. Roughly how many applications in total sets the scale your inventory aims for. Neither has to be exact.
Then you choose your asset types under What do you want to catalogue?, grouped three ways:
- Business — business units, business capabilities, business processes, products and services, projects and initiatives, teams
- Applications and data — applications, integrations, components, APIs, data objects, data stores
- Technology and operations — technologies, servers, locations, vendors
Applications, integrations, components and business units are selected by default. These are starting templates, not a fixed schema — you can add types later from Inventory, and create your own whenever nothing offered fits.
Adding your data
Your first workspace is created empty and lands you on Import data. There are three ways in, and all of them end the same way — with a proposal you confirm.
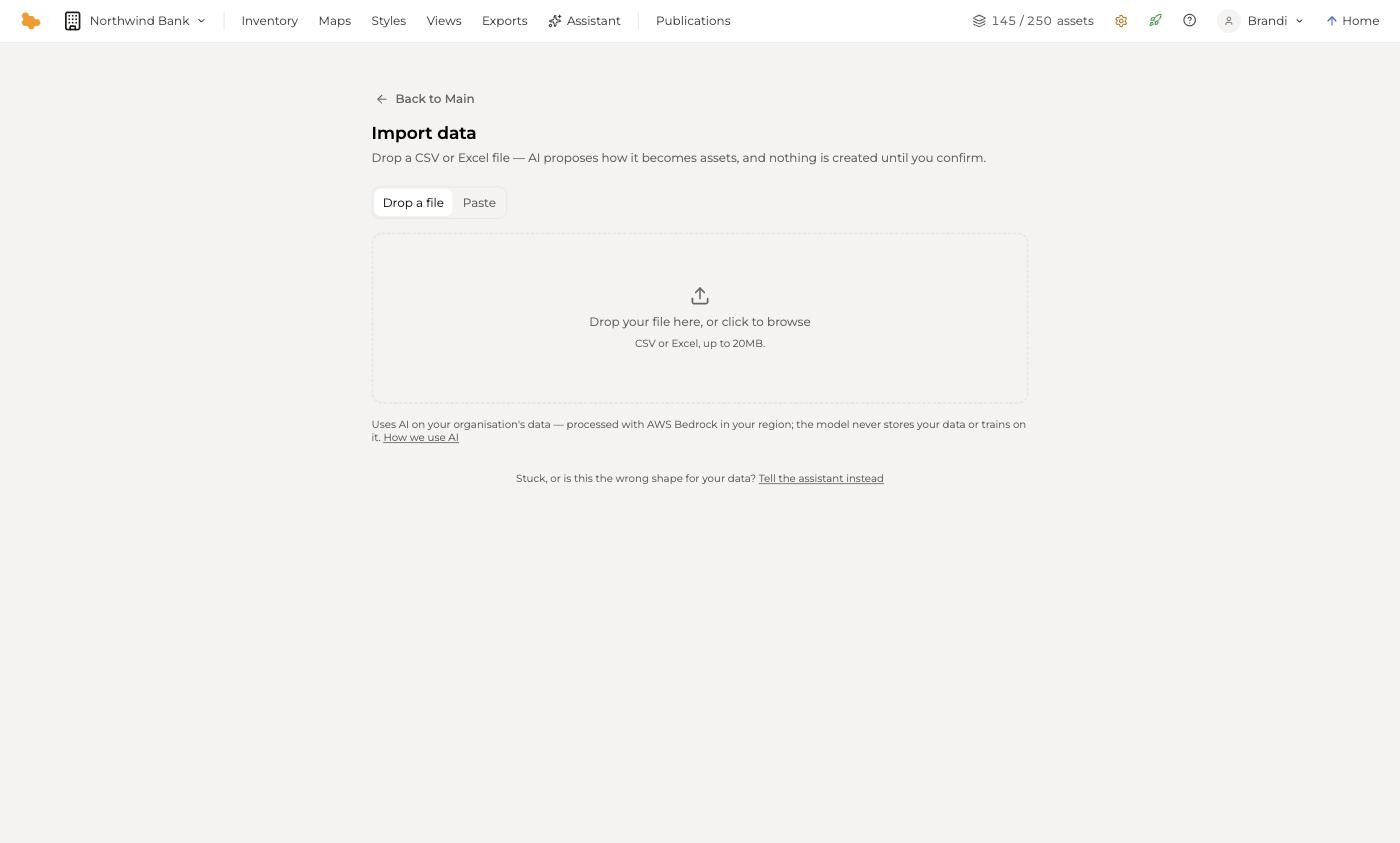
Drop a file takes a CSV or Excel file up to 20MB. Paste takes tabular text straight from a spreadsheet. Both are read against the profile you just set, so the same file lands differently in a bank than in a logistics firm.
Draft samples instead is for when you have nothing to hand. Aplas drafts a plausible starting inventory at your declared scale and shape — applications, the teams and business units behind them, and the integrations between them. Every row arrives marked as sample data: edit a row to keep it for real, or clear them all in one click.
Drafting is capped at 100 applications, because that is the most one draft produces. A larger estate is better seeded from a file than generated.
If none of the three fits your data, Tell the assistant instead opens the same pipeline as a conversation.
Confirming what gets created
Nothing is written until you say so. What will be created summarises the proposal before you commit it:
- a count per asset type, each expandable with Show all to see every name
- how the assets will be linked — applications to their teams, business units, capabilities and technologies; integrations to the applications at each end; components and APIs to their applications
- Drafted from these assumptions, holding the industry and scale the draft used. Change either, or name the partners you work through — payment gateways, carriers, EDI hubs — and Re-draft with these
- Show column mapping, when the proposal came from a file or a paste
If the proposal would take you past your plan's asset allowance, Aplas says so here rather than after the fact. Assets already in your inventory count once, so a re-import of data you already hold may cost less than the headline number, or nothing at all.
Create assets commits the proposal. Start over discards it.
Where things live
The studio nav follows the same order as the ideas above:
| Section | What it holds |
|---|---|
| Inventory | Your asset types and assets, and the grid you browse and edit them in |
| Connectors | Workspaces kept in sync with LeanIX — see Connectors |
| Maps | Map views, with the map builder |
| Styles | The shared expression layer — how views are painted |
| Views | Every other way of looking at the inventory: tables, matrices, graphs, flows |
| Exports | Documents generated from the workspace, and a record of everything taken out |
| Assistant | Describe what you have, or hand over a file, in conversation |
| Publications | What is live right now, at what URL, and who can see it |
Your organization, plan and API keys live behind the settings icon in the top-right; workspaces are managed there too.