Style Overview
Create powerful styles to tell stories on your software map
Once you have created a software index and built a software map, you can design a style. Styles are a powerful part of Aplas that allows you to customize every aspect of how your software maps render. This is useful if you want to tell a specific story to a particular audience (e.g. cloud migration status to an ops team or project scope to a steering committee).
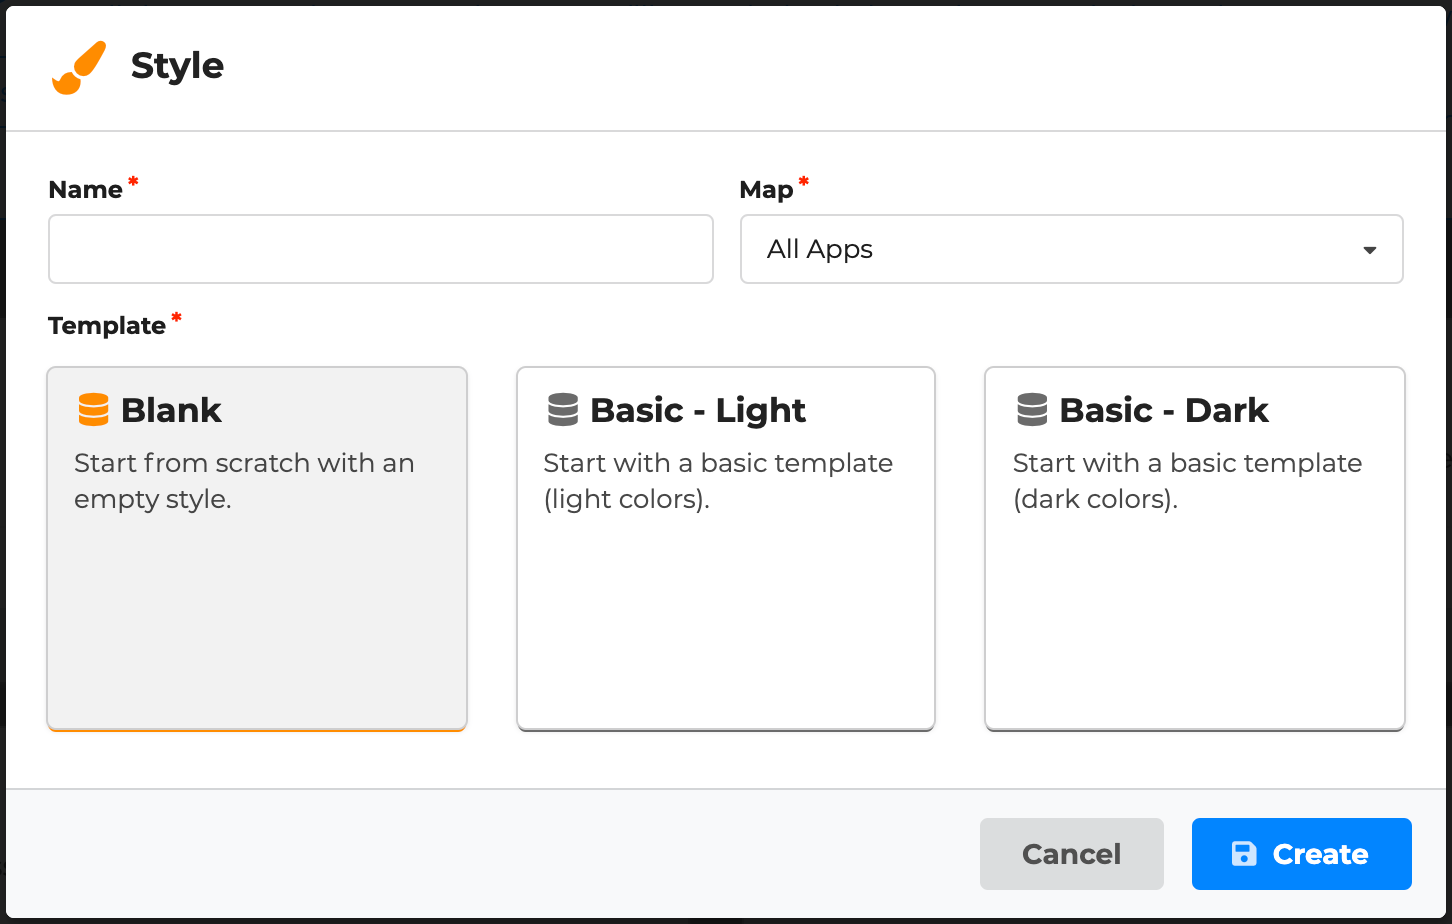
Create a style
- Within Aplas Studio, visit the style area.
- Click "Create" to create and give your style a name.
- Select the software map to use as the basis for your style.
- Select a template as a starting point. It's often better to add custom layers on top of a basic template.
Anatomy of a style
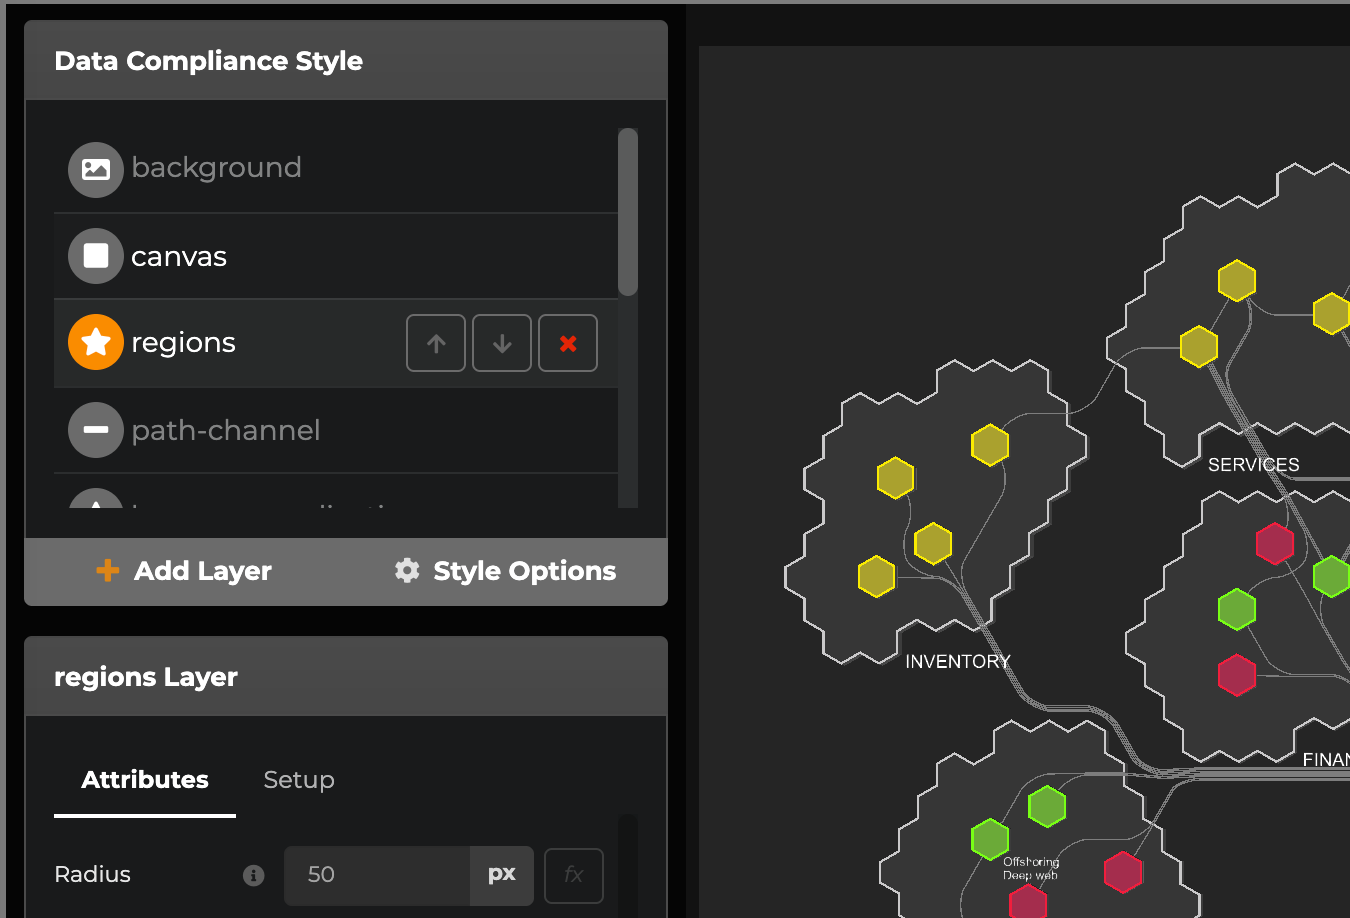
Styles are composed of a series of style layers. Each layer links a particular attachment type (from a software map) to a particular draw type (rendering to your screen). When a series of layers are combined into a style, we can present a cohesive software map to a user (including regions, applications, labels, etc.).
Layer draw types
There are several draw types, each rendering map attachments in a different way.
- Background: Color present underneath all other layers.
- Canvas: A frame drawn around the maps attachments. Possible to include your organization's logo and a title for the style.
- Circle: Link to application or region attachments, displaying a circle.
- Cylinder: Link to application or region attachments, displaying a cylinder.
- Hexagon: Link to application or region attachments, displaying a hexagon.
- Path: Link to channel attachment, that uses a specialised algorithm for drawing connections between applications.
- Symbol: Link to application or region attachments, displaying text like application or tag name.
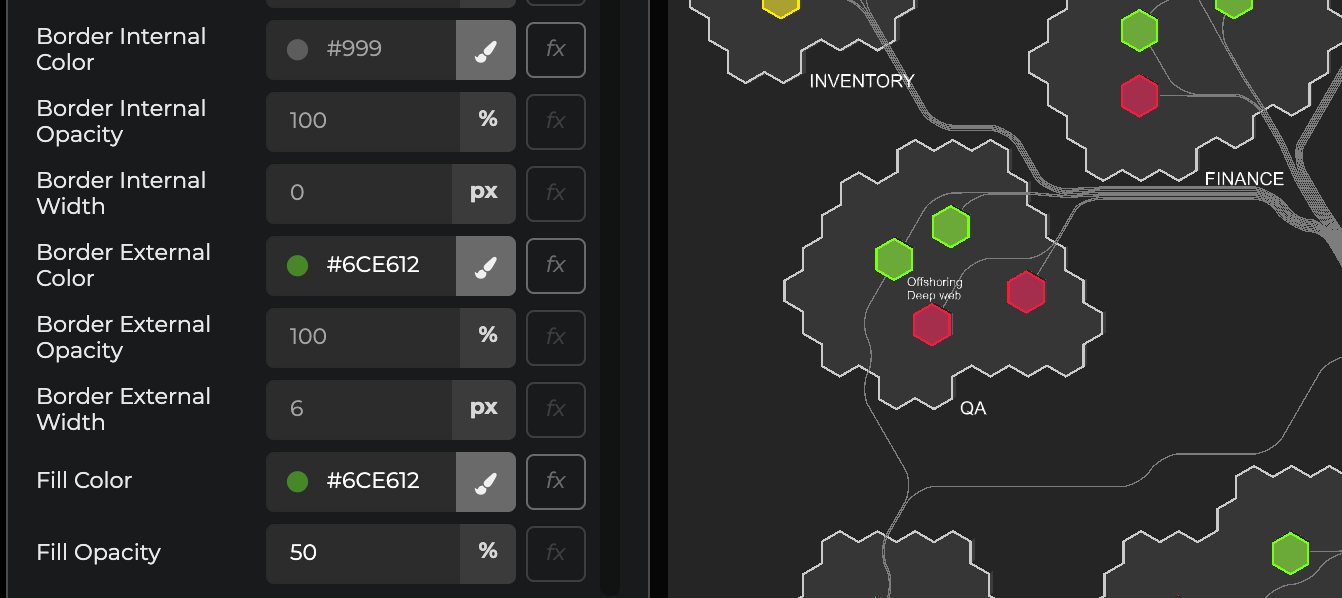
Each draw type has a series of attributes that can be used to customize how the layer is presented. It is common to different segments of index data linked to layers with different tyles (e.g. risk rating of applications with different fill colours).
Adding a layer
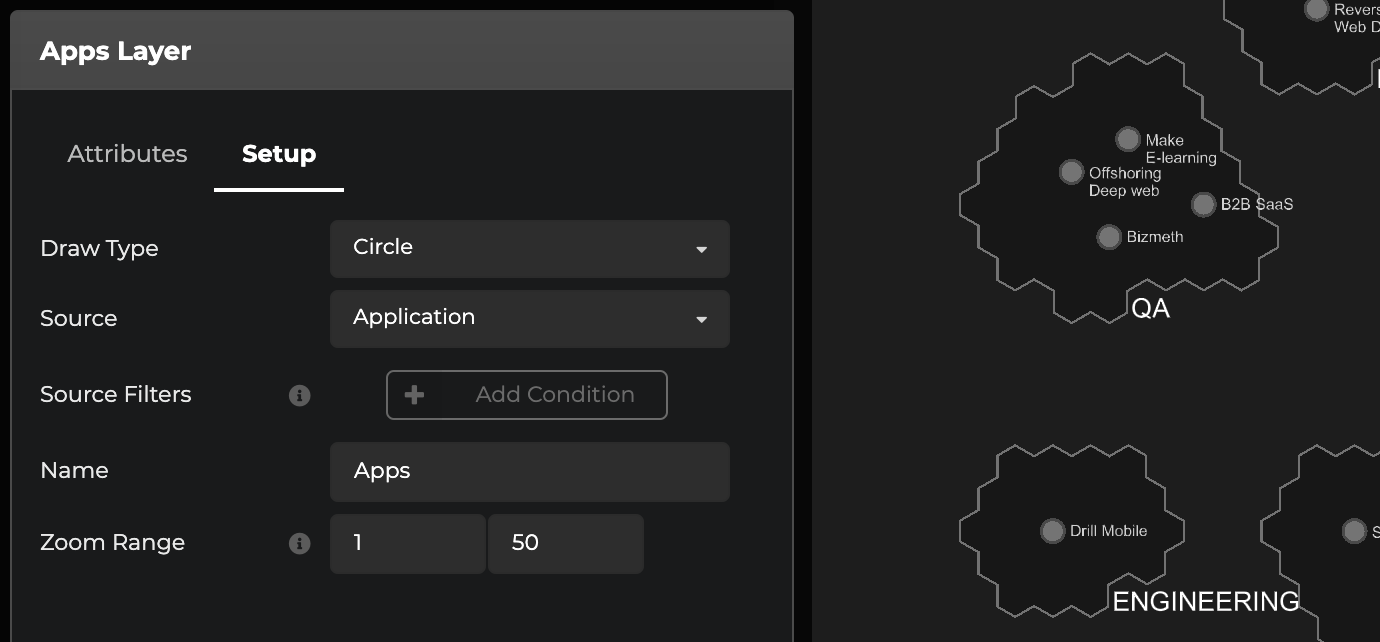
- Click the Add Layer to create a layer.
- Select an appropriate draw type.
- Select a map source (except for background & canvas draw types).
- (optional) Add source filters conditions to reduce the attachments that will be rendered. This is one of the most important parts of the style designer, allowing you to create colourful layers that only display certain assets (e.g. applications with a status of retired).
- (optional) Specify a name.
- (optional) Override the zoom range. Often used for symbols when that is unreadable at distant zoom levels (e.g. 20+).
Key features
Source filters
By default, style layers are rendered for every associated asset in an index. This might be useful for building up the "static" parts of your style, but you will need to filter some layers to illustrate the differences between assets (e.g. risk rating). In Aplas you can filter based on built-in fields (like name) or any of your custom fields.

Multiple conditions can be set to either broaden (or) or limit (and) your filter.
Reference values
Some layer attributes can reference fields from your index (including built-in and custom fields). Specify the field's id surrounded by braces.

Built-in fields include:
- id
- name
- shortName
- tag.id
- tag.name
- tag.color
Custom fields must be referenced with their exact id.
It is also possible to include more complex references. For, example {cost/1000} to ensure an extrusion isn't too high, or {'$'+cost} to prepend the dollar sign to a symbol.
Value functions
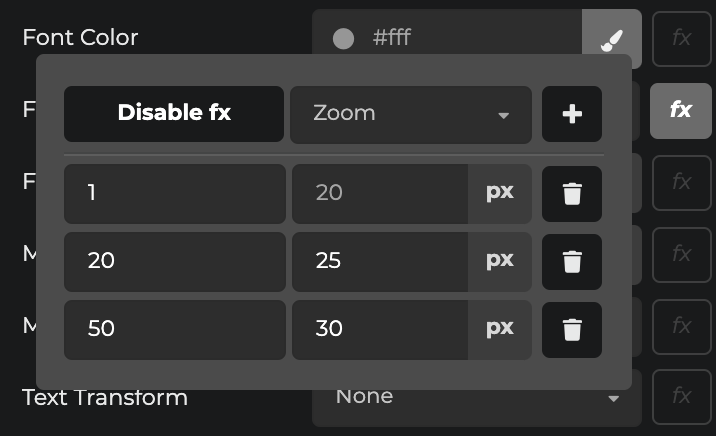
Layer functions provide a mapping between the input value and what is provided to the layer attribute. Often, this is used for gradually changing attributes as the zoom level of the map changes.
Designing a style in JSON
It is possible to author styles as code using our style import/export functionality. We suggest you start with one of our templates then export the style as a starting point.

Here's a snippet of a partial style:
{
  "$schema": "https://aplas.com/assets/schema/style/v1/styleSchema.json",
  "id": "layer_highlight",
  "description": "",
  "version": "1.0",
  "parameters": [],
  "layers": [
    {
      "sourceType": "application",
      "zoomFilter": {
        "min": 1,
        "max": 50
      },
      "drawType": "circle",
      "name": "circle-apps",
      "attributes": [
        {
          "id": "radius",
          "value": "40"
        },
        {
          "id": "fill-color",
          "value": "#bbb"
        },
        {
          "id": "border-color",
          "value": "#666"
        },
        {
          "id": "border-opacity",
          "value": "50"
        },
        {
          "id": "fill-opacity",
          "value": "50"
        },
        {
          "id": "border-width",
          "value": "8"
        }
      ],
      "sourceFilter": {
        "connective": "and",
        "filters": []
      }
    }
  ]
}
The style JSON schema is available here.
If you get stuck on a particular part of the schema, we recommend authoring in the style designer UI first, then repeating the export.
Updated 5 months ago