 Aplas Docs
A guide for viewers
You have been sent an Aplas view — here is how to read it
Someone in your organization has published a view of the systems you run, and sent you the link. You open it with your Aplas account — publications are for the members of your organization — and you cannot break anything: a published view is read-only.
This page is for people who consume views. If you maintain the catalogue yourself, start at Getting started.
Getting in
A published view opens to members of the organization that published it, once they have signed in. If the link lands you on a sign-in page, use the account your organization invited you with. If you are signed in but not yet a member, the link offers you a way to request access; an Owner or Admin can also invite you from Configuration > Users.
Some publications are narrowed further, to named users. If you are signed in and the link shows Not Found, you are not among them — again, the person who sent it is the one to ask. The page deliberately says nothing more than that, so that a stranger with a guessed address learns nothing.
What you are looking at
Aplas catalogues the things your organization runs — applications, the integrations between them, the teams that own them, the capabilities they support — and renders that catalogue in whatever shape answers the question at hand.
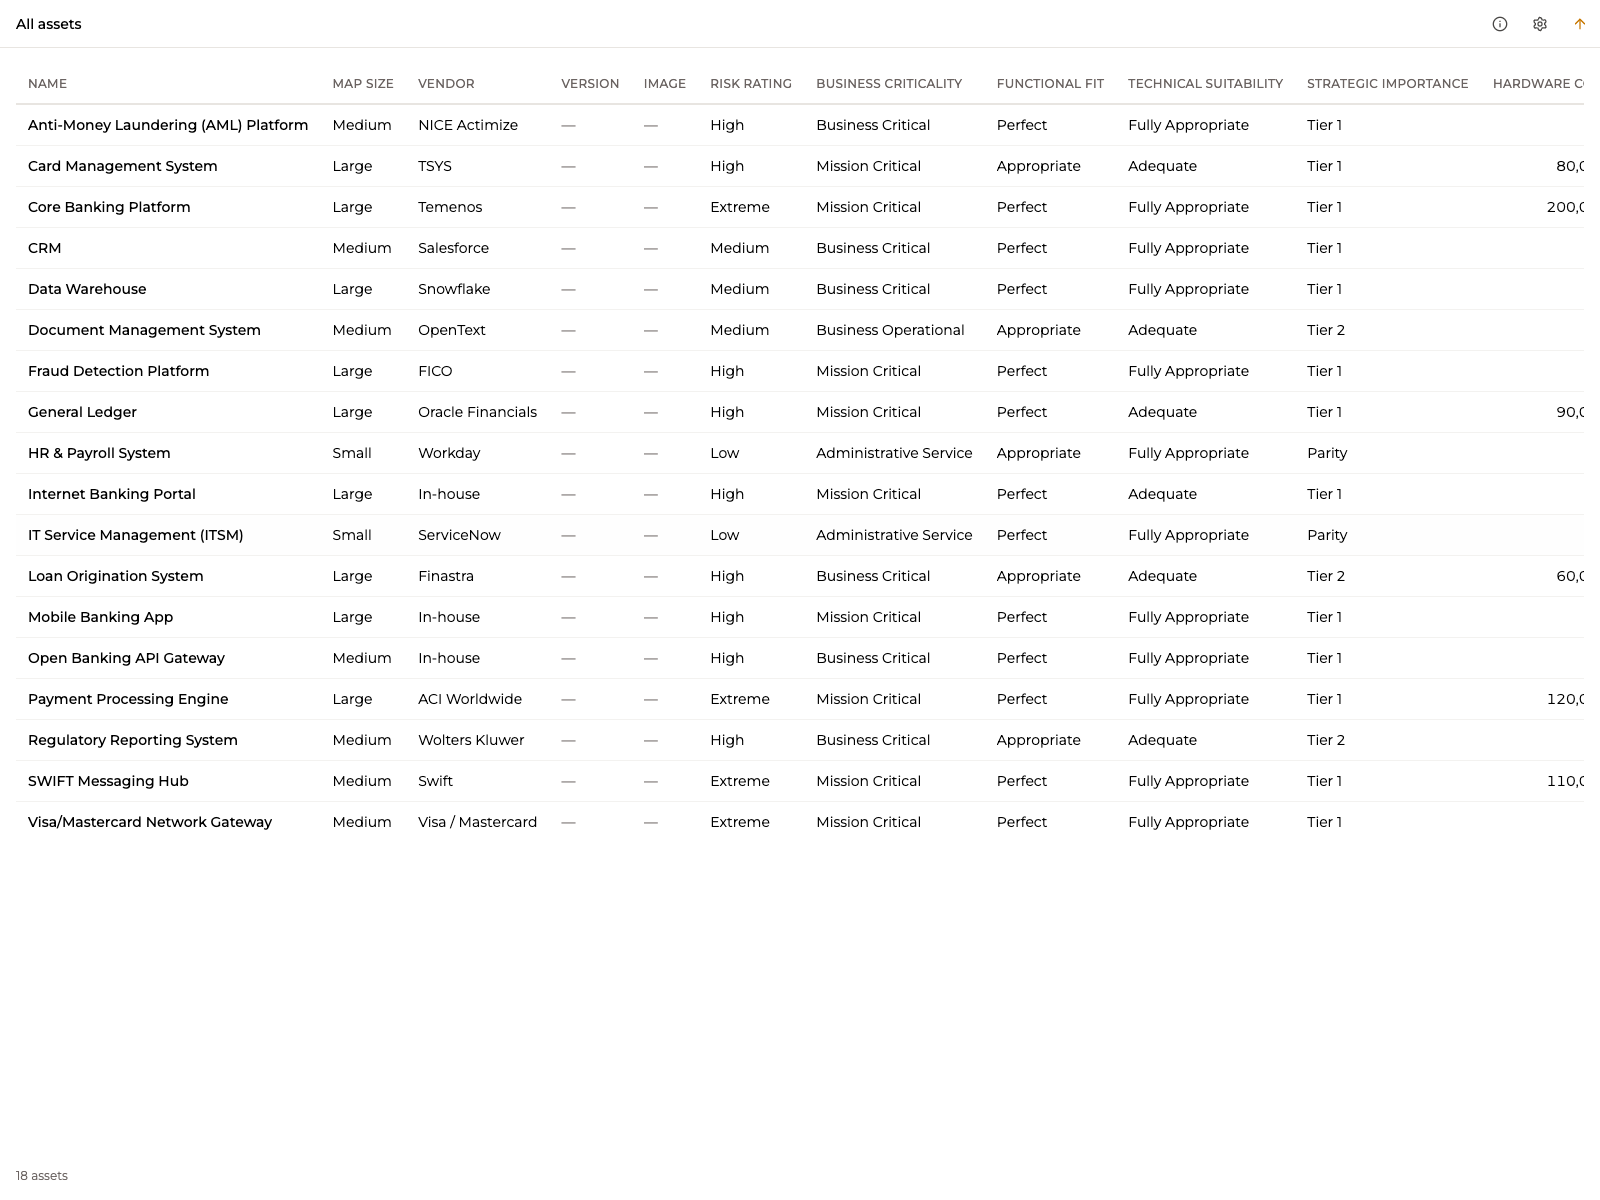
A view is one such shape, scoped by whoever published it. It might be a table of applications, a matrix of coverage, a graph of dependencies, or a map.
Reading a map
A map is the one that repays a little explanation, because it uses geography deliberately.
| On the map | Means |
|---|---|
| Region | Ownership or grouping. Everything belonging to Finance sits in the same region |
| Node | One asset — a small service, or a core system |
| Channel | The movement of data between two assets. One line can carry several integrations |
The point of a map is that things stay put. The same system is in the same place next month, so the layout becomes something you know rather than something you re-read each time.
Navigate it the way you would any map: drag to pan, scroll to zoom, and click a node, channel or region to see what it is.
Use a map when you are not sure what to search for. Zoom out for how the organization fits together; zoom in on one region to see how a business unit actually works.
Reading a table or a matrix
Tables and matrices are for questions with a definite answer — which applications are mission critical, which capabilities have no system behind them, what a team owns.
They carry the columns the publisher chose. Sorting and searching within the view are yours to use; they change nothing for anyone else.
Colour
Colour on a map is not decorative. It comes from a style the publisher chose, and it always encodes a field — risk rating, lifecycle, cost, migration status. If a legend is shown, it tells you which. If you cannot tell what the colours mean, ask whoever sent you the link, because they picked it.
What you cannot do
A published view is read-only, and that is enforced on our side rather than merely hidden. Nothing you click writes back to the catalogue.
If something in a view is wrong or out of date, the fix is with the people who maintain it. They are the same people who sent you the link.