Map Overview
Once you have created a software index and populated it, you can build a software map. A map gives your software a consistent place, allowing your business to gain familiarity with your software over time.
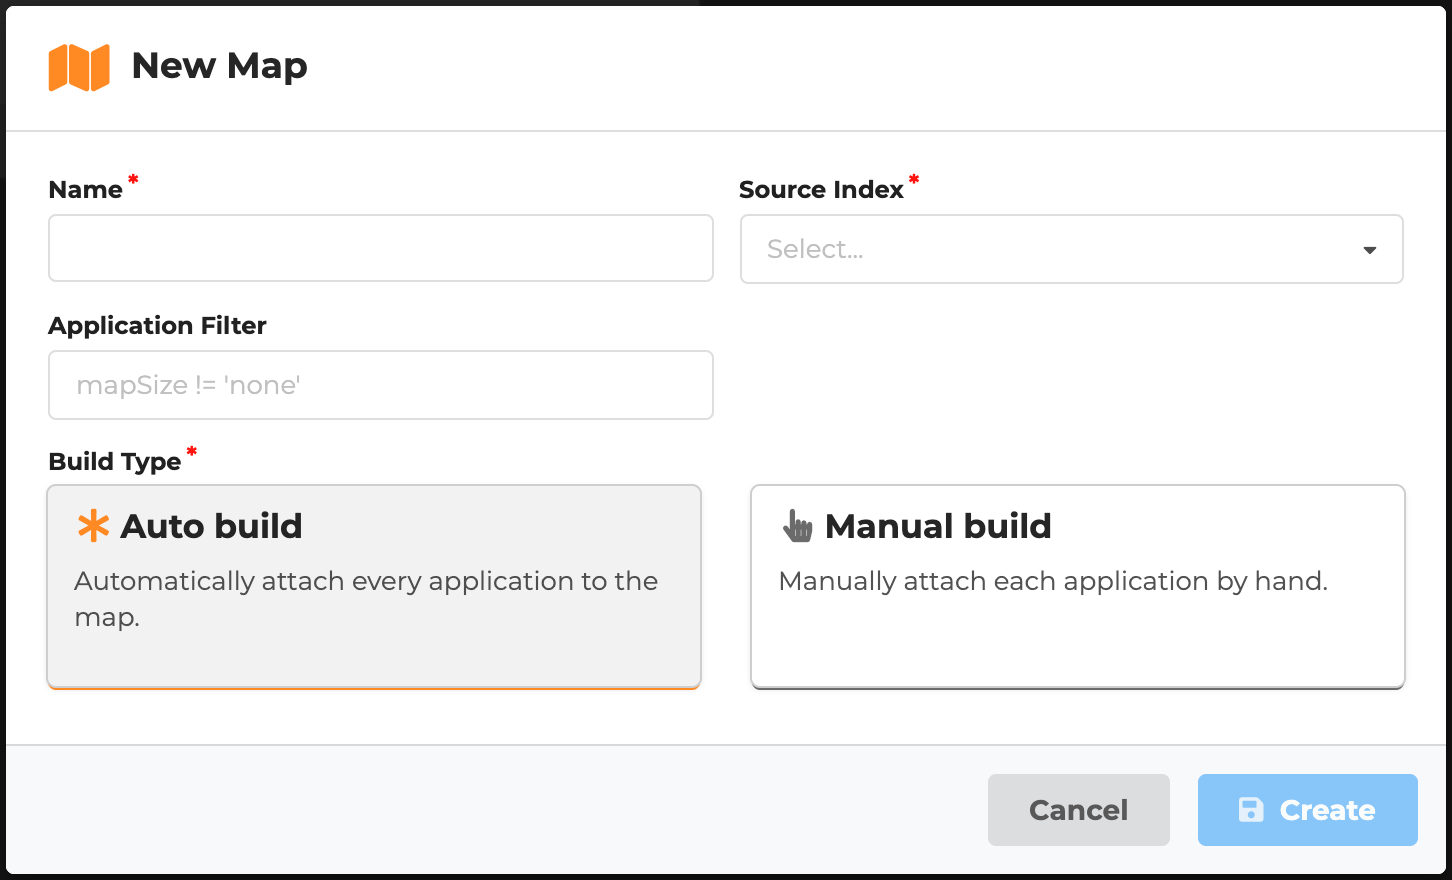
Creating a software map
- Within Aplas Studio visit the map area.
- Click create and give your map a name.
- Select the software index that will drive your map.
- Optionally, specify an application filter to limit what applications can be placed on the map (see below for more information.
- Select a build type (see below for more information).

Anatomy of a map
A software map is comprised of (1) a hexagonal grid, and (2) a series of attachments to that grid. Each attachment links an index asset to one or more grid cells. For example, applications are attached to a single cell, while integrations are attached to a series of cells.
There are three different attachment types:
- Application: This is how index applications are attached to a map. Applications can be manually or automatically placed on a map.
- Integration Channel: All the index integrations between two applications are collapsed into an integration channel. As applications are attached to the map, integration channels are always automatically placed. This algorithm is smart enough to ensure channels that are heading in the same general direction are bundled together. This is a critical part of reducing the visual complexity of a software map.
- Region: As applications are attached, a region is automatically placed around it. Regions are linked to an index application category. So if you attach two applications from the same category next to one another, their regions will collapse into a single region. Whereas applications from different categories will stay separate, creating a border between the two regions.
Why a hex grid? One of the biggest challenges in visualizing large software networks is how to visualize the integrations. Often we end up with a cobweb of lines that confuses the audience and provides little analytical value. The use of a hexagonal grid reduces the number of angles lines that can be drawn on the map to six. Cartographers use this technique to reduce the visual complexity of public transport maps.
Filters
There are four ways to filter what assets from your index are displayed on a map.
Tag group
Applications are only shown on a map if they are linked to an application tag. If you have multiple application tag groups, you can both change how applications are applied to regions on the map and filter what applications are shown.
Application filter
The application filter limits the applications that can be attached to a map. By default, a built-in application field mapSize is used to filter the map with mapSize != none. This is a great way to exclude applications that might not add value to your software map (e.g. desktop applications that aren't integrated into anything).
Application filters can also be used to create multiple maps, where each map could have a different subset of applications. Here are some further examples:
category.id = 'asia*'- where category starts with "asia".id = 'a*' | id = 'b*'- where id starts with the letters "a" or "b".type != 'Infrastructure'- where custom field named "type" doesn't equal "Infrastructure".status='phase-in'- where built-in status field is Phase In.
Integration filter
The integration filter limits the integrations that can be attached to a map. To apply a filter, please follow the example syntax above.
Region depth
By reducing region depth, you limit the nesting of application tags that are translated to regions on the map.
Map generation
There are two different ways of building a map:
- Automatic: Aplas uses a physics simulation model to generate a map automatically. This algorithm can place applications in a way that reduces the overall distance travelled by integration channels.
- Manual: Auto-generating a map is essential when you have a lot of assets. But for smaller maps, you have the choice to craft a software map by hand. See our guide to manually building a map.
Map maintenance
Maps that are automatically generated are also automatically maintained. A cluster of servers monitors any changes to an index and carries out the following process:
- Filter out any index changes that could not affect the map
- Batch index changes over a few seconds for efficiency
- Load the full map with existing positions
- Add the index changes to map
- Run physics simulation model
- Saves the new map changes
The changes in an index can take between 2 and 6 minutes to reflect on a map. During maintenance updates, the physics model is configured to balance the need for an optimal map with the need for consistency over time (i.e. ensuring a map does not radically change with minor updates to the index).
Updated 5 months ago