 Aplas Docs
Browsing and editing the grid
Search, facets, filters, columns, bulk edits and export
Opening an asset type from the Inventory rail gives you its grid. The grid is where catalogue maintenance actually happens — slice the set, fix what is wrong, take the result away.
Your search, filters and sort live in the URL, so a sliced grid is a link you can send to a colleague and a page that survives a reload. Your column choice and density do not — they are yours, remembered in your browser, and a colleague opening your link sees their own.
Search
Search applications… in the toolbar filters the grid as you type, matching names, descriptions and text fields.
Facets and filters
Below the type list, the left rail carries the open type's facets — one block per choice, boolean or relation field, each value with a count:
MAP SIZE
  Large      9
  Medium     8
  Small      1
VENDOR
  In-house   5
  FICO       1
Check a value to filter instantly. Active filters appear above the grid under FILTERED BY as removable chips. A choice value whose option has been given a colour carries its swatch here and in every grid cell that holds it.
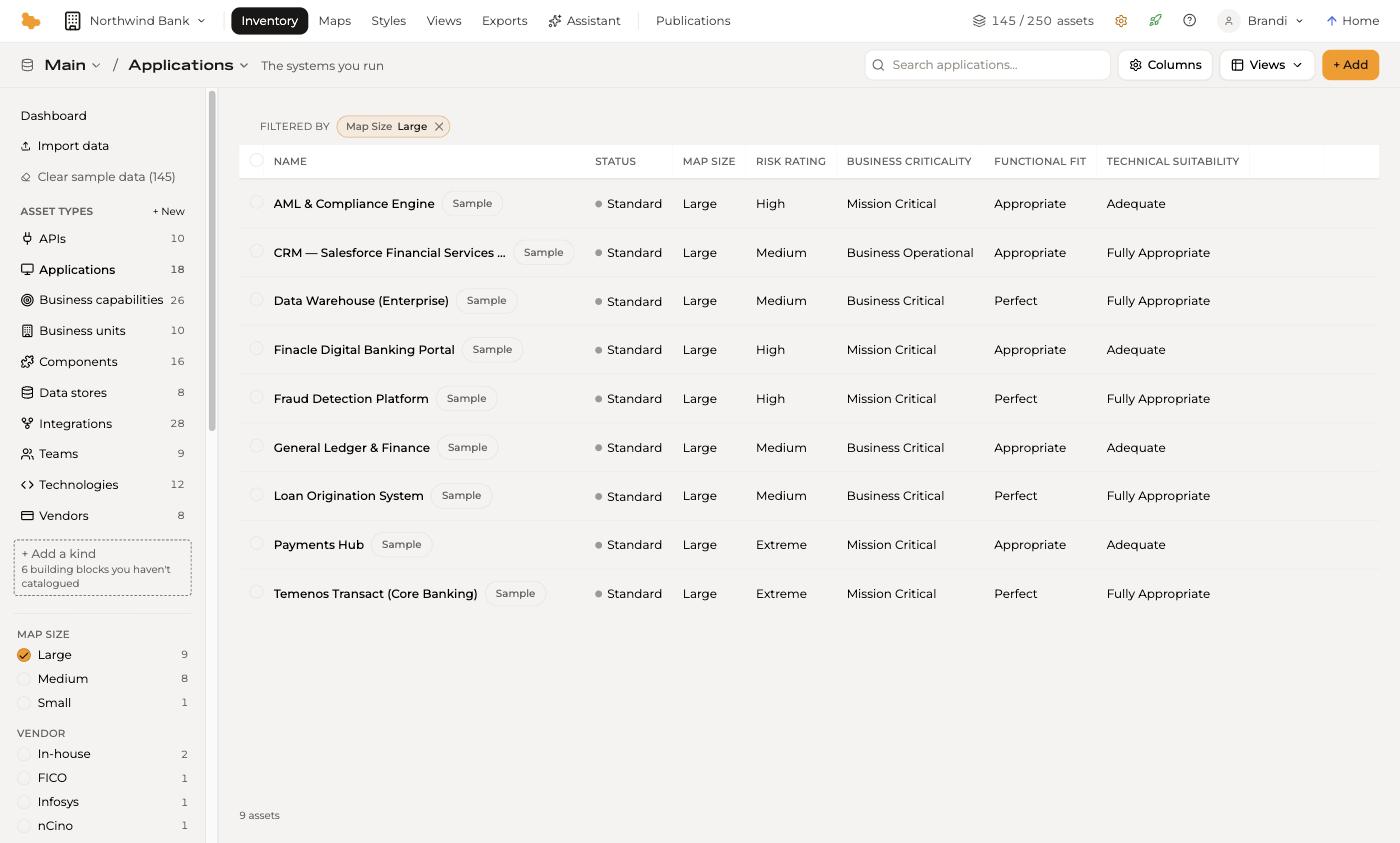
Facet counts are filter-aware: they re-count against what is already filtered, so they always tell you how many rows a given value would actually add. With Map Size: Large applied, the Vendor counts drop to those of the nine large applications, and vendors with none disappear from the list.
Sorting
Click a column header to sort by it; click again to reverse. Choice fields sort in their own defined order rather than alphabetically — a risk rating sorts Extreme, High, Medium, Low.
Columns and density
Columns in the toolbar opens one popover holding both:
- Density — Comfortable or Compact
- Columns — the shown columns with arrows to reorder them, and below, every other field on the type, ready to be switched on
A type's default columns are derived from its fields, so a grid is useful the first time you open it without any setup.
Both settings are remembered, at different scopes. Column choice is per asset type, per workspace — the fields differ between types, and the same type can carry different fields in different workspaces, so the choice cannot sensibly be shared. Density is per person, everywhere — it is a preference about your screen, not a fact about a type.
Both are stored in your browser, so they are per-device: the same account on another computer starts from the derived defaults again.
Editing
Selecting a row opens the asset detail panel, where fields are editable in place. + Add creates a new asset of the open type.
For changes across many assets, tick the rows you want. A bar appears at the foot of the grid:
2 selected Set a field… Set status… Delete ClearSet a field… applies one value to every selected asset, Set status… does the same for status, and Delete removes them after one confirmation. Clear drops the selection without changing anything.
Export
The type menu — the chevron beside the type name in the breadcrumb — carries Export, and it names the number of rows it will produce:
Export 18 rows      → no filter applied
Export 9 rows       → with Map Size: Large applied
That is the contract: the export is exactly what you are looking at. The visible columns, the active search and filters, and the current sort all carry through. A row hidden by a filter is not in the file.
Every export is also recorded in Exports, so the workspace keeps one ledger of what left it, regardless of which screen produced the file.
Saving a grid as a view
A filtered, sorted, arranged grid is worth keeping. Views in the toolbar saves it:
- Save as new view turns the current grid state into a table view
- saved views are listed in the same menu, and applying one restores its filters, columns and sort
A saved view is a real view, so it appears in the Views section of the studio alongside your matrices, graphs and maps — and like any view, it can be published.