 Aplas Docs
Inventory overview
Asset types, fields and relations — the shape of what you catalogue
Inventory holds everything you catalogue. It is the one place assets are created and edited; every view elsewhere in the studio reads from it.
Assets and asset types
An asset is one thing you manage — an application, a team, a data store, a business capability. Every asset belongs to an asset type, and the type decides what fields the asset has and what it can be related to.
Aplas ships starting templates for the common types, grouped three ways:
- Business — business units, business capabilities, business processes, products and services, projects and initiatives, teams
- Applications and data — applications, integrations, components, APIs, data objects, data stores
- Technology and operations — technologies, servers, locations, vendors
You choose which of these your workspace starts with. The templates are a starting point, not a fixed schema: add a type later, or create your own when nothing offered fits.
The dashboard
Opening Inventory lands on the workspace dashboard: one card per asset type carrying its count, and a Recent changes feed naming who changed what and when.
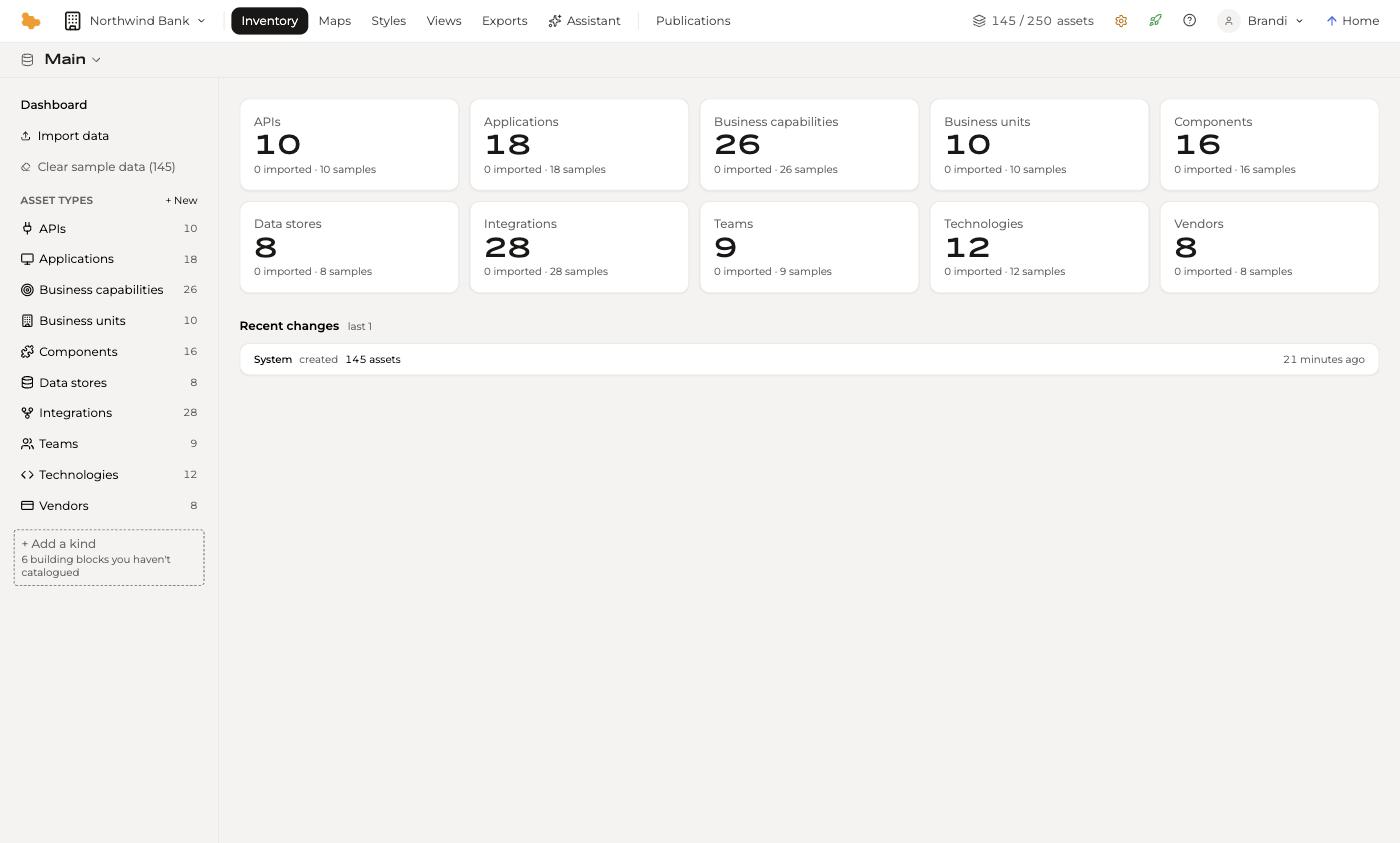
The left rail lists every type in the workspace with a live count, and ends with + Add an asset type — the one door to adding one, and it tells you how many built-in types you have not catalogued yet. It opens a dialog offering those types as one-click adds, or a form to define a type of your own.
On a workspace with more types than fit beside the filters, the rail collapses the list to the type you are in; click it for the full list, grouped by category.
Fields
Each type carries its own fields. An application, for example, arrives with a name, short name and description, plus fields such as map size, vendor, version, image, risk rating, business criticality, functional fit, technical suitability, costs, go-live date and whether it contains PII.
Open a type's settings from the type menu in the breadcrumb — the chevron beside the type name — and choose Type settings. It opens a page with three tabs: General for the type's names, description, icon and colour, Fields for its schema, and Display for how it appears on the workspace dashboard. Fields you add become available everywhere the type appears: in the grid's column picker, in the detail panel, in filters and in exports.
On the Fields tab each field is a row — label, type, whether it is required, and how many assets already use it — and selecting one opens its settings beside the list. The count is worth reading before you rename or remove a field: it is telling you how much data is stored under that field's id.
Field types matter beyond storage. A choice field becomes a facet you can filter by and sorts in its own order rather than alphabetically — a risk rating sorts Extreme, High, Medium, Low, which is what you want and what an alphabetical sort would destroy.
The General tab also carries the Connectivity asset switch — the declaration that a type's records connect a source to a target, drawn on the map as roads rather than places. That is a modelling decision with its own page: Modelling connections.
Option colours
Each option of a choice field can carry a colour. On the Fields tab, open the field and every option shows a Colour row beneath its value and label: a slashed swatch for no colour, then twelve named swatches — Blue, Deep blue, Sky, Green, Grass green, Lime, Yellow, Tangerine, Red, Magenta, Purple, Violet. Click one to give the option that colour; click the slashed swatch to take it away again. The options of the built-in fields arrive uncoloured, so a risk rating reads as text until you decide that Extreme is red.
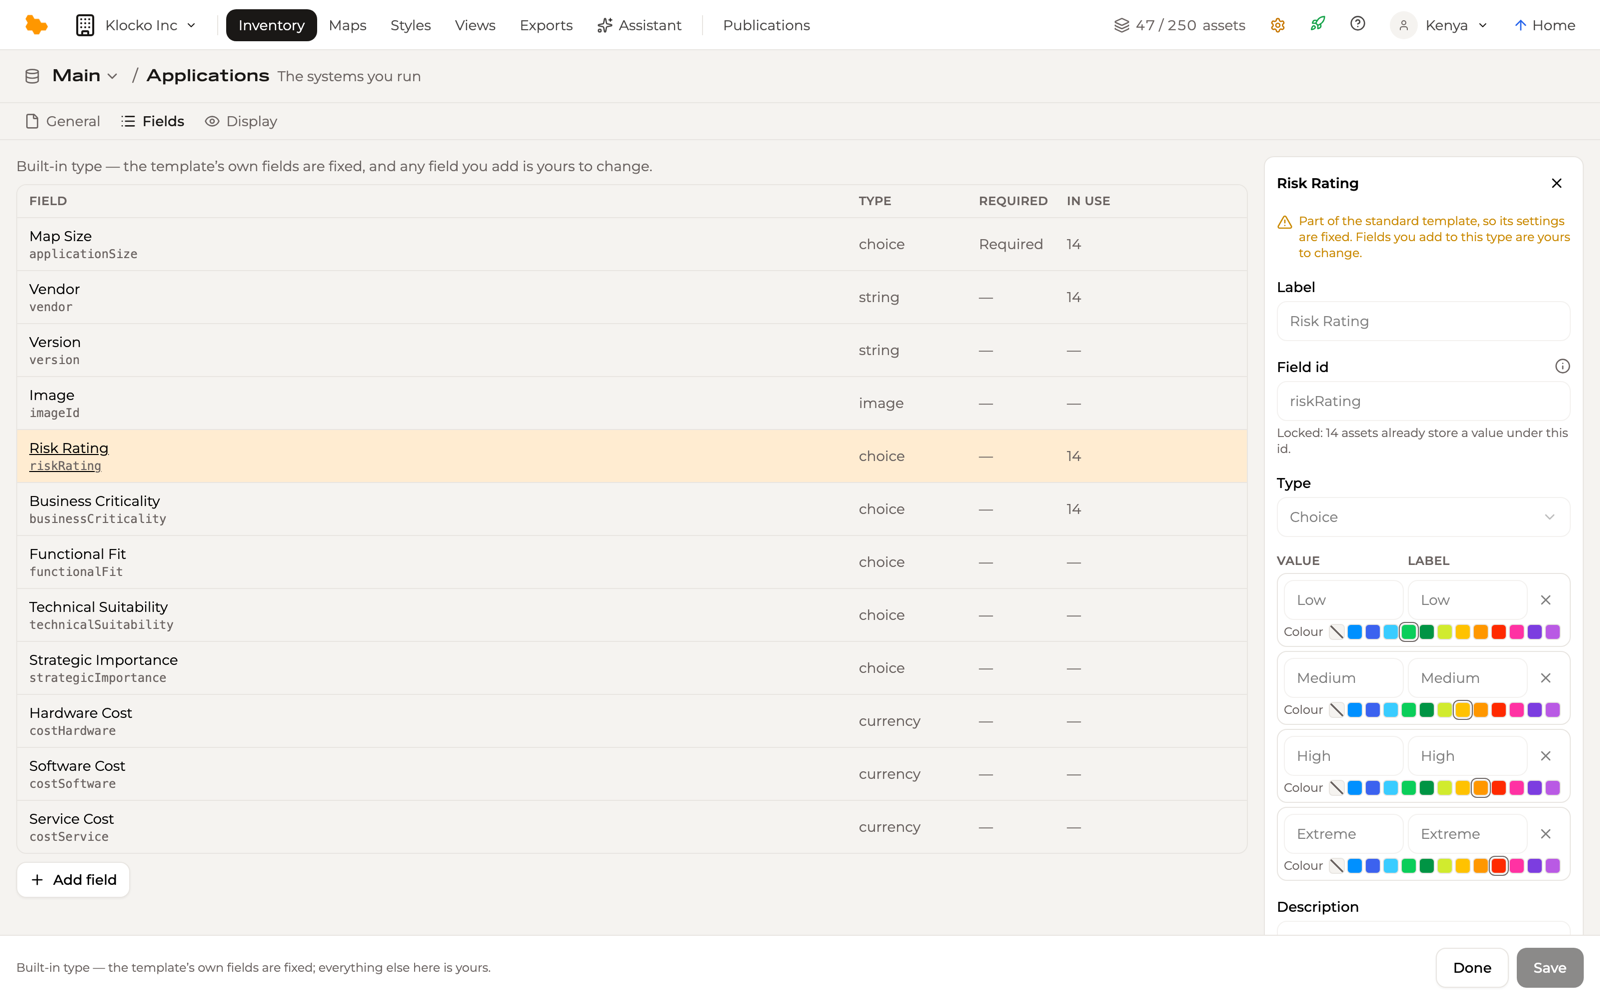
A colour you set follows the option everywhere the value is shown as a value:
- in the grid and the table view, as a swatch beside the label in every cell
- in the facet rail, as a dot beside the value's count
- in the asset detail panel, on the Fields tab
- on a matrix whose rows or columns are that field, as a swatch in the axis header
- on a Flow view set to Colour by that field, as the colour of the ribbons
Published views carry the same colours. What it does not touch is the map: a map's colours come from its style, which encodes a field with its own colour stops. Exports carry the label, not the colour.
An option with no colour shows as a plain label — no swatch in the cell, the rail or the matrix header. The Flow is the exception: it has to paint every ribbon something, so it picks a colour from a generated palette for the options you have not coloured. Setting a colour replaces that pick with yours, and pins it.
Relations
Assets are connected to each other by relations, and the relation is typed. Open any asset and its Relations tab groups everything it touches by relationship type, each with a count:
INTEGRATION (via Integration)  (6)
OWNED BY                       (2)
REALIZES                       (1)
RUNS ON                        (1)
COMPOSED OF                    (3)
CONSUMES                       (1)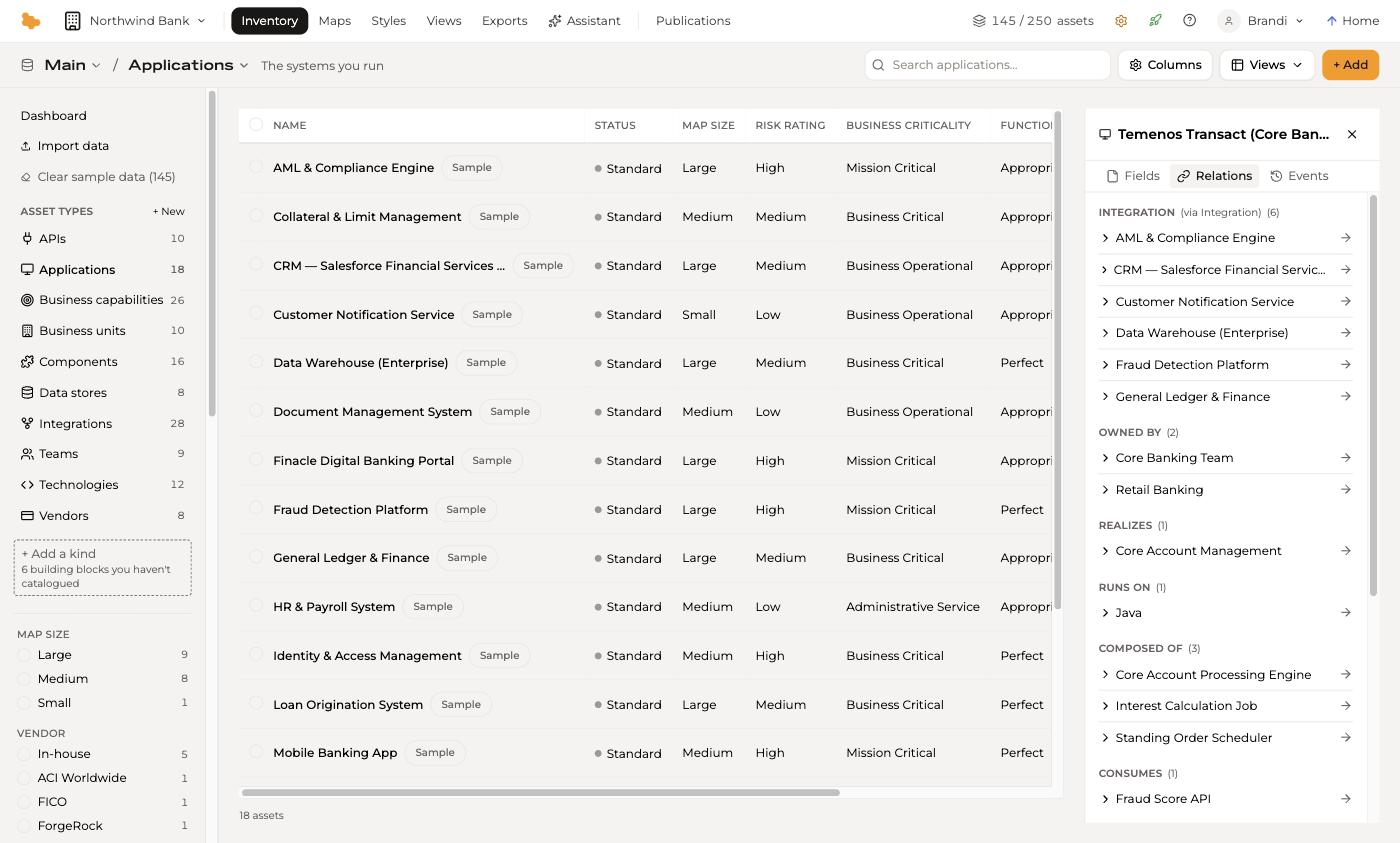
Each entry expands in place, and an arrow opens the asset at the other end.
The verbs — owned by, runs on, depends on — are the workspace's relationship types. A workspace starts with eighteen, you can add your own, and each can carry a colour that the graph and the Flow view draw with.
Relations are what make the inventory more than a list of spreadsheets. They are also what a map draws: an integration between two applications becomes a line, and a grouping relation becomes a region. Connections can be recorded as relations or as assets in their own right; Modelling connections is the guide to that choice.
Sample data
Assets drafted by Aplas rather than supplied by you are marked Sample in the grid. They exist so a new workspace has something to work with, and they are deliberately easy to get rid of:
- edit a row to keep it — editing a sample asset makes it real
- Clear sample data in the left rail removes every remaining sample asset in one action, with the count shown so you know what you are clearing
Sample assets count towards your plan's asset allowance like any other, which is why clearing them is one click rather than a hunt.
The asset detail panel
Selecting an asset opens a panel beside the grid with three tabs:
| Tab | What it holds |
|---|---|
| Fields | Every field on the asset, editable in place |
| Relations | What it is connected to, grouped by relationship type |
| Events | Its history — who changed what, and when |
A record of a connectivity type — an Integration, say — carries a fourth tab, Composition, listing the steps inside the connection. See Composition.
The Events tab records the origin of an asset as well as its edits, so an asset created by an import reads as such, with its initial values and relations available behind a single expander.